
By Afla KC, Level Up HR Solutions
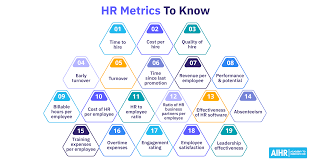
Most HR teams are drowning in metrics. Time-to-hire. Cost-per-hire. Training hours per employee. Offer acceptance rate. These are fine. They’re like a car’s dashboard lights – useful, but they won’t tell you if you’re driving toward a cliff.
What actually predicts business success? Not just HR success. Business success.
After working with dozens of companies – from 20 -person startups to 2,000-person enterprises – I’ve found exactly three HR metrics that reliably predict revenue growth, customer satisfaction, and long-term profitability.
Not one more. Not one less.
Let me walk you through them. No spreadsheet anxiety required.
Metric #1: Voluntary vs. Involuntary Turnover Ratio (The “Who Leaves” Number)
Most people track total turnover. That’s like saying “some water leaked from the bucket” without knowing if it was clean water or poison.
The real metric is: Of all the people who left, how many chose to leave vs. were asked to leave?
Here’s why it matters.
When high performers choose to leave voluntarily, your business bleeds. They take relationships, institutional knowledge, and future revenue with them. A stu
dy by the Center for American Progress found that replacing a high-earning employee costs anywhere from 100% to 150% of their annual salary. But the soft cost is worse: teams lose energy, clients feel the shift, and other top performers start wondering if they should also leave.
When low performers leave voluntarily? That’s ac
tually good news. They self-select out. Your culture gets cleaner.
And when you involuntarily let someone go – especially a low performer – that’s also healthy. You’re pruning the garden.
The magic number? A high voluntary turnover among your top 20% of performers is a five-alarm fire. It predicts flat or declining revenue within 6–12 months.
How to track it (without losing your mind)
 Run an exit interview for every voluntary leaver. Ask one question: “On a scale of 1–10, how would you rate your manager?” Low scores here predict future voluntary turnover across the team.
- Segment your turnover data by performance rating. If your top bucket (e.g., “exceeds expectations”) has a voluntary turnover rate above 10% annually, you have a problem.
- Compare voluntary turnover in high-revenue roles vs. support roles. Losing a top salesperson hurts differently than losing an intern.
Humanised example: I worked with a SaaS company that had 18% total turnover – respectable by industry standards. But when we sliced the data, we found that 80% of their voluntary leavers were in the top two performance tiers. They were losing their best engineers to competitors. Revenue growth stalled. Once they fixed the why (no career pat
hs), growth returned. The total turnover number never changed – but the right people stayed.
Metric #2: Internal Mobility Rate (The “Growth Feeling” Number)
Here’s a truth that most HR dashb
oards ignore: People don’t leave companies. They leave a lack of movement.
The internal mobility rate is simple: What percentage of your open roles are filled by internal candidates vs. external hires?
That’s it. But that single number predi
cts more about long-term business success than almost anything else.
Why? Because when employees see someone get promoted from within, they think: “That could be me next year.” When they see only external hires, they think: “I have to leave to grow.”
LinkedIn’s 2023 Workplace Learning Report found that employees who move internally are 3.5x more likely to be engaged than those wh
o don’t. Engaged employees produce higher quality work, stay longer, and refer better friends.
But here’s the business prediction part: Companies with high internal mobility (above 30%) consistently outperform their competitors on profit margins. Why? Because internal hires already know the product, the culture, and the customers. They ramp up in weeks, not months. They don’t need to be “onshored” into the company values.
How to track it (simple version)
- Every quarter, count how many positions you filled.
- Count how many went to existing employees (promotion, transfer, or lateral move).
- Divide internal fills by total fills. Multiply by 100.
That’s your internal mobility rate.
Benchmark: Below 20%? You’re a revolving door for talent. 20–35%? Solid. Above 35%? You’re building a career destination.
Humanized example
A mid-sized logistics company I advised had terrible retention among dispatchers. Turnover was 45% annually. They kept hiring externally because “we need fresh blood.” When they finally calculated their internal mobility rate, it was 7%. Seven percent!
They started small: every team lead role would first be offered to internal dispatchers. Within a year, internal mobility hit 28%. Turnover among dispatchers dropped to 22%. But the real win? Customer complaints fell by 40%. Because experienced internal hires knew the routes, the drivers, and the problems before they happened. That’s business success.
Metric #3: Manager Quality Score (The “Would I Follow You Into Battle?” Number)
This is the most uncomfortable metric. Because it measures… managers. And managers are usually the ones reading the report.
But let’s be honest: people join companies and leave managers.
Gallup has studied this for decades. Their finding is brutal: 50% of employees have left a job at some point to get away from their manager. Not for more money. Not for a better title. To escape a bad boss.
So how do you measure something as squishy as “manager quality”?
You ask the people who report to them. Anonymously. And you ask one specific question that predicts business outcomes better than any other:
“My manager cares about me as a person, not just as an employee.”
That’s it. No 50-question engagement survey. No “rate your manager on a scale of 1–5 on strategic vision.”
Why does this predict business success? Because when people feel cared for as humans – with lives, bad days, doctor’s appointments, and crying kids in the background – they give discretionary effort. They stay late to solve a client problem. They speak up with ideas. They don’t quietly quit.
And the data backs this up: Teams with managers who score in the top quartile on this question have 50% lower turnover, 22% higher profitability, and 38% higher productivity (per Gallup).
How to track it (painlessly)
Once a quarter, send a three-question pulse survey to every employee:
- My manager cares about me as a person. (Agree/Disagree scale)
- I know what’s expected of me at work. (Agree/Disagree)
- If I mess up, my manager helps me learn rather than blames me. (Agree/Disagree)
Aggregate scores by manager. Don’t publish individual names to leadership. But do share each manager their own score, anonymously compared to company average.
The rule: Any manager scoring below 60% agreement on question #1 needs coaching within 30 days. If scores don’t improve in two quarters, that manager is costing the business more than they’re saving.
Humanized example
A retail chain I worked with had two regional managers. Same pay, same territory size, same resources.
Region A’s manager scored 92% on “cares about me as a person.” Region B’s manager scored 38%.
Over one year:
- Region A turnover: 18% | Sales growth: +12%
- Region B turnover: 47% | Sales growth: -5%
Same company. Same products. Completely different results. The only variable was the manager’s ability to make people feel human.
They didn’t fire the low-scoring manager. They enrolled her in a 12-week leadership communication program. A year later, her score was 71%. Turnover dropped to 26%. Sales turned positive. That’s the power of measuring the right thing.
Putting It All Together (Without Overwhelm)
You don’t need a 50-metric HR dashboard. You need three numbers that you can check in under 10 minutes each month:
MetricHow Often to CheckWhat It PredictsVoluntary turnover among top 20% of performersMonthlyFuture revenue declineInternal mobility rate (% of roles filled internally)QuarterlyEmployee engagement & retentionManager quality score (cared-for-as-a-person)QuarterlyTeam productivity & profitability
If these three are healthy, your business will almost certainly grow. If they’re sick, no amount of employer branding or free snack bars will save you.
A Final Human Note
I’ve seen HR leaders obsess over perfect spreadsheets while their best people update LinkedIn on their phones under the desk. I’ve seen founders celebrate low “total turnover” while losing their only two product managers who actually understood the codebase.
Metrics are just mirrors. They show you what’s already there.
The three metrics above work because they measure human behavior – who stays, who grows, who feels cared for. And human behavior, unlike quarterly earnings forecasts, doesn’t lie.
So next week, don’t run another engagement survey with 47 questions. Don’t benchmark your time-to-hire against “industry standards.” Just pull three numbers:
- Who left? (And were they any good?)
- Who moved up? (Or did we hire outsiders for every open role?)
- Do people feel seen by their manager? (Or are they silently suffering?)
Answer those three questions honestly, and you won’t just predict business success.
You’ll create it.